|
|
HP OpenVMS systems documentation |
| Previous | Contents | Index |
The debugger is installed on your system with a default debugger resource file (DECW$SYSTEM_DEFAULTS:VMSDEBUG.DAT) that defines the startup defaults for the following customizable parameters:
A copy of the system default debugger resource file with explanatory comments is included in Example 10-1 in Section 10.10.4.
You can modify the first three of these display attributes interactively from the HP DECwindows Motif for OpenVMS user interface, as explained in Section 10.10.1, Section 10.10.2, and Section 10.10.3. In each case, you can save the modified display configuration for future debugging sessions by choosing Save Options from the Options menu.
In addition, you can modify all the listed attributes of the debugger display configuration by editing and saving the debugger resource file, as explained in Section 10.10.4.
When you choose Save Options from the Options menu or you edit and save the local debugger resource file, the debugger creates a new version of the local debugger resource file DECW$USER_DEFAULTS:VMSDEBUG.DAT that contains the definitions of the display configuration attributes. When you next start the debugger, it uses the attributes defined in the most recent local resource file to configure the output display. You can fall back to previous debugger display configurations with appropriate use of the DCL commands DELETE, RENAME, and COPY.
To fall back to the system default display configuration, select
Restore Default Options from the OpenVMS Debugger Options menu.
10.10.1 Defining the Startup Configuration of Debugger Views
To define the startup configuration of the debugger views:
When you next start the debugger, the debugger uses the most recent resource file to create the new display configuration.
You can also define the startup display configuration by editing the
definition of these views in the resource file (see Section 10.10.4).
10.10.2 Displaying or Hiding Line Numbers in Source View and Instruction View
The source view and instruction view display source line numbers by default at debugger startup. To hide (or display) line numbers at debugger startup:
When you next start the debugger, the debugger uses the most recent resource file to create the new display configuration.
You can also set the startup default for line numbers by setting the following resources to either True or False in the resource file (see Section 10.10.4).
DebugSource.StartupShowSourceLineno: True DebugInstruction.StartupShowInstLineno: True |
10.10.3 Modifying, Adding, Removing, and Resequencing Push Buttons
The buttons on the push button view are associated with debugger
commands. You can:
You cannot modify or remove the Stop button. |
To save these modifications for future debugger sessions, choose Save Options from the Options menu.
Section 10.10.3.1, Section 10.10.3.2, and Section 10.10.3.3 explain how to customize push buttons interactively through the HP DECwindows Motif for OpenVMS user interface. You can also customize push buttons by editing the resource file. Button definitions in the resource file begin with:
DebugControl.Button |
(See Example 10-1.)
10.10.3.1 Changing a Button's Label or Associated Command
To change a button's label or associated command:
EVALUATE %s |
EXAMINE %%NEXTLOC |
To save these modifications for future debugger sessions, choose Save Options from the Options menu.
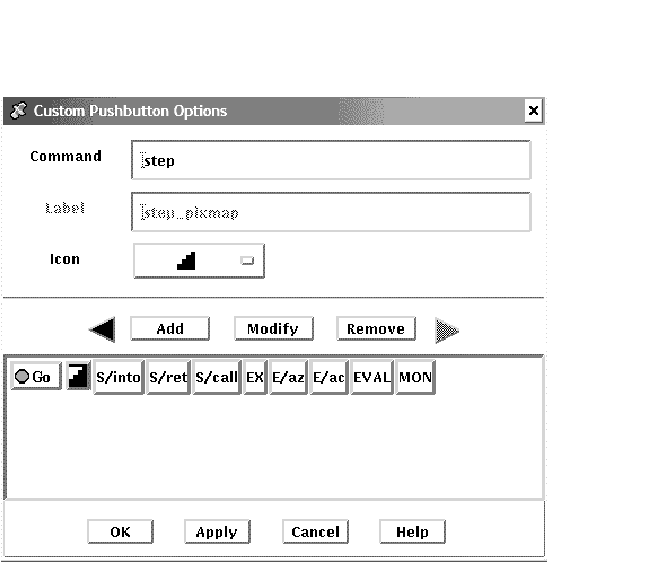
Figure 10-23 Changing the STEP Button Label to an Icon
To add a new button to the push button view and assign a debugger command to that button:
To save these modifications for future debugger sessions, choose Save Options from the Options menu.
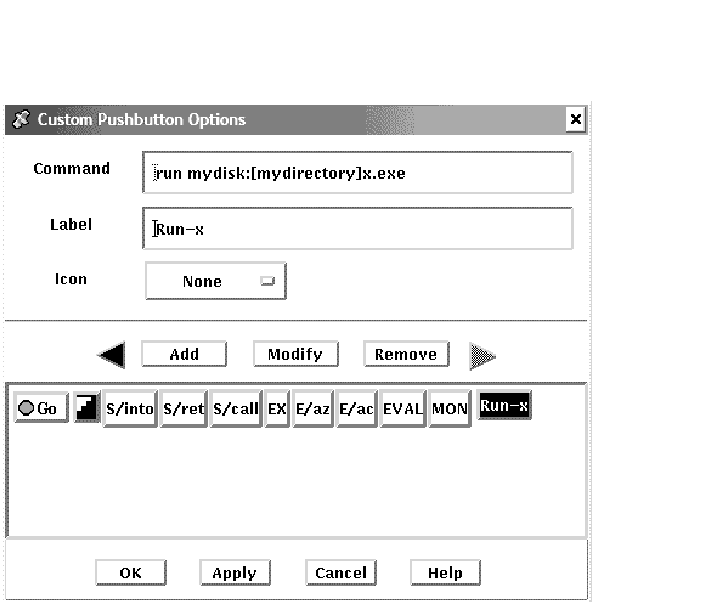
Figure 10-24 Adding a Button
To remove a button:
To save these modifications for future debugger sessions, choose Save
Options from the Options menu.
10.10.3.4 Resequencing a Button
To resequence a button:
To save these modifications for future debugger sessions, choose Save
Options from the Options menu.
10.10.4 Editing the Debugger Resource File
The debugger is installed on your system with a default debugger resource file (DECW$SYSTEM_DEFAULTS:VMSDEBUG.DAT) that defines the default display configuration for the debugger. When you modify the display attributes as described in Section 10.10 and then save the modifications with the Save Options command in the Options menu, the debugger creates a local debugger resource file, DECW$USER_DEFAULTS:VMSDEBUG.DAT. You can edit this file to further modify the debugger display configuration.
If you do not have a local debugger resource file, you can create one with the Restore Default Options item in the Options menu. Whenever you start the debugger, it creates the debugger display configuration as defined in the most recent version of the local debugger resource file if there is one; otherwise, the debugger uses the definitions in the system debugger resource file, DECW$SYSTEM_DEFAULTS:VMSDEBUG.DAT.
You cannot edit the system resource file. You can modify the debugger display configuration either by following the procedures in Section 10.10.1, Section 10.10.2, and Section 10.10.3, or by editing and saving your local debugger resource file.
Example 10-1 contains a copy of the system default debugger resource file. Most entries are annotated within the file or are self-explanatory. Section 10.10.4.1, Section 10.10.4.2, Section 10.10.4.3, and Section 10.10.4.4 contain additional information about modifying certain key sequences. For complete information about specifying key sequences, see the translation table syntax in the X Toolkit Intrinsics documentation.
The line in Example 10-1 that begins with DebugControl.ButtonList does not completely fit in this example. This line identifies the button definitions contained in the file. The full line in the file also contains the following button names: StepReturnButton, StepCallButton, ExamineButton, ExamineASCIZButton, ExamineASCICButton, EvalButton, MonitorButton. |
| Example 10-1 System Default Debugger Resource File (DECW$SYSTEM_DEFAULTS:VMSDEBUG.DAT) |
|---|
!
! OpenVMS Debug32/64 Debugger Resource File
!
DebugVersion: 71
!
! GEOMETRY RESOURCES:
!
! Written when you execute "SAVE OPTIONS" from the Options Menu.
!
DebugSource.x:   11
DebugSource.y:   30
DebugSource.width:  620
DebugSource.height:  700
!
DebugControl.x:   650
DebugControl.y:   30
DebugControl.width:  600
DebugControl.height:  700
!
DebugEditor.x:   650
DebugEditor.y:   30
DebugEditor.width:  600
DebugEditor.height:  700
!
DebugInstruction.x:  11
DebugInstruction.y:  769
DebugInstruction.width:  620
DebugInstruction.height: 243
!
*DebugBrowser.x:  650
*DebugBrowser.y:  30
*DebugBrowser.width:  335
*DebugBrowser.height:  300
!
! LINE NUMBER DISPLAY RESOURCES:
!
!   Create the line or address number display in views at startup?
!
DebugSource.StartupShowSourceLineno: True
DebugInstruction.StartupShowInstLineno: True
DebugInstruction.StartupShowInstAddrno: False
!
! WINDOW PANE RESOURCES:
!
! Relative size of panes in main window.
! Main window height is derived from sum of panes.
!
DebugSource*SrcView.height:  460
DebugSource*PushbuttonPanel.height: 36
DebugSource*MessageOutputPanel.height: 145
!
DebugControl.BreakpointView.height: 175
DebugControl.MonitorView.height: 150
DebugControl.TaskView.height:  130
DebugControl.RegisterView.height: 250
!
! CUSTOM BUTTON RESOURCES:
!
! The following resources determine which buttons to put in the button panel.
! Buttons will show in the order they are listed here.
! For each button there MUST be a set of associated resources.
! EXAMPLE:
!   ButtonCommand    - Associates a command with the button.
!   ButtonLegend     - Button Label or pixmap name if pixmap flag is True.
!   ButtonPixmapFlag - If True uses ButtonLegend as predefined pixmap name.
!
DebugControl.ButtonList: \ GoButton, StepButton, StepInButton, ...

!
DebugControl.ButtonCommand.GoButton:  go
DebugControl.ButtonLegend.GoButton:  go_pixmap
DebugControl.ButtonPixmapFlag.GoButton:  True
!
DebugControl.ButtonCommand.StepButton:  step
DebugControl.ButtonLegend.StepButton:  STEP
DebugControl.ButtonPixmapFlag.StepButton: False
!
DebugControl.ButtonCommand.StepInButton: step/in
DebugControl.ButtonLegend.StepInButton:  S/in
DebugControl.ButtonPixmapFlag.StepInButton: False
!
DebugControl.ButtonCommand.StepReturnButton: step/return
DebugControl.ButtonLegend.StepReturnButton: S/ret
DebugControl.ButtonPixmapFlag.StepReturnButton: False
!
DebugControl.ButtonCommand.StepCallButton: step/call
DebugControl.ButtonLegend.StepCallButton: S/call
DebugControl.ButtonPixmapFlag.StepCallButton: False
!
DebugControl.ButtonCommand.ExamineButton: examine %s
DebugControl.ButtonLegend.ExamineButton: EX
DebugControl.ButtonPixmapFlag.ExamineButton: False
!
DebugControl.ButtonCommand.ExamineASCIZButton: examine/asciz %s
DebugControl.ButtonLegend.ExamineASCIZButton: E/az
DebugControl.ButtonPixmapFlag.ExamineASCIZButton: False
!
DebugControl.ButtonCommand.ExamineASCICButton: examine/ascic %s
DebugControl.ButtonLegend.ExamineASCICButton: E/ac
DebugControl.ButtonPixmapFlag.ExamineASCICButton: False
!
DebugControl.ButtonCommand.EvalButton:  evaluate %s
DebugControl.ButtonLegend.EvalButton:  EVAL
DebugControl.ButtonPixmapFlag.EvalButton: False
!
DebugControl.ButtonCommand.MonitorButton: monitor %s
DebugControl.ButtonLegend.MonitorButton: MON
DebugControl.ButtonPixmapFlag.MonitorButton: False
!
! THE FOLLOWING RESOURCES CAN ONLY BE CHANGED BY EDITING THIS FILE.
! -----------------------------------------------------------------
! Be sure to trim off any trailing white-spaces.
!
! FONT RESOURCES:
!
!   If a font is specified for a view, and the font is available on the
!   system, it will be used for that view.
!
!   For any views which do not explicitly specify a font, the font specified
!   by the resource "DebugDefault.Font" will be used if it is available on the
!   system.
!
!   If no font resources are specified at all, the debugger will use the
!   systems own default font specification.
!
!   The "DebugOptions.Font" applies to all optional views.  We suggest that
!   you select a font with a point size no larger than 14 in the option views
!   in order to preserve label alignment.
!
!   Using 132 column sources?  Try this narrow font:
!       -dec-terminal-medium-r-narrow--14-100-100-100-c-60-iso8859-1
!
!              FORMAT:   -*-FONTNAM-FACE-T-*--*-PTS-*-*-*-*-CHARSET
!
DebugDefault.Font:  -*-COURIER-BOLD-R-*--*-120-*-*-*-*-ISO8859-1
DebugSource.Font:   -*-COURIER-BOLD-R-*--*-120-*-*-*-*-ISO8859-1
DebugInstruction.Font:   -*-COURIER-BOLD-R-*--*-140-*-*-*-*-ISO8859-1
DebugMessage.Font:  -*-COURIER-BOLD-R-*--*-120-*-*-*-*-ISO8859-1
DebugOptions.Font:   -*-COURIER-BOLD-R-*--*-120-*-*-*-*-ISO8859-1
!
! STARTUP RESOURCES: 3=Iconified, 0=Visible
!
DebugSource.initialState:  0
DebugControl.initialState:  0
DebugEditor.initialState:  0
DebugInstruction.initialState:  0
!
! COLOR RESOURCES:
!
! Use any of the OSF Motif Named Colors.
!
! Foreground = Text Color, Background = Window Color
!
! Try: Gainsboro, MintCream, Linen, SeaShell, MistyRose, Honeydew
!      Cornsilk, Lavender
!
! To use your system default color scheme, comment out all lines
! pertaining to color.
!
! Common color scheme (unless overridden for a specific view)
!
*background:     Gainsboro
*borderColor:     Red
!
! Source View Colors
!
!DebugSource*background:   Gainsboro
DebugSource*topShadowColor:                     WindowTopshadow
DebugSource*bottomShadowColor:                  WindowBottomshadow
DebugSource*src_txt.foreground:   blue
DebugSource*src_txt.background:   white
DebugSource*src_lineno_txtw.foreground:  red
DebugSource*cnt_msg_txt.foreground:  black
DebugSource*cnt_msg_txt.background:  white
!
! Control View Colors
!
!DebugControl*background:   Gainsboro
DebugControl*topShadowColor:                    WindowTopshadow
DebugControl*bottomShadowColor:                 WindowBottomshadow
!
! Instruction View Colors
!
!DebugInstruction*background:   Gainsboro
DebugInstruction*topShadowColor:                WindowTopshadow
DebugInstruction*bottomShadowColor:             WindowBottomshadow
DebugInstruction*inst_txt.foreground:  blue
DebugInstruction*inst_txt.background:  white
DebugInstruction*inst_addrno_txtw.foreground:  red
!
! Editor Colors
!
!DebugEditor*background:   Gainsboro
DebugEditor*topShadowColor:                 WindowTopshadow
DebugEditor*bottomShadowColor:              WindowBottomshadow
DebugEditor*edit_textw.foreground:  black
DebugEditor*edit_textw.background:  white
!
! REGISTER VIEW RESOURCES:
!

! Which Registers to display by default in the Register View?
! CF = Call Frame, GP = General Purpose, FP = Floating Point (I64 and Alpha Only)

!
*Show_CF_Registers.set:  True
*Show_GP_Registers.set:  False
*Show_FP_Registers.set:  False
!
! SHOW MESSAGE/COMMAND SEPARATOR LINES?
!
*Show_Message_Separators.set:  True
!
! TRACK LANGUAGE CHANGES? (parser follows module language)
!
*Track_Language_Changes.set:  False
!
! KEY SEQUENCE RESOURCES:
!
! Key sequence used to activate the dialog box for conditional and action
! breakpoints.
!
DebugSource.ModifyBreakpointToggleSequence: Ctrl <Btn1Down>, Ctrl <Btn1Up>
!
! GENERAL KEYPAD FUNCTIONS:
!
!<Key>0xFFB0=KP0, <Key>0xFF91,<Key>0xFFB0=GOLD-KP0,
!<Key>0xFF94,<Key>0xFFB0=BLUE-KP0, <Key>0xFFB1=KP1,
!<Key>0xFF91,<Key>0xFFB1=GOLD-KP1, <Key>0xFFAC=KP,
DebugSource.*XmText.translations:#override\n\
    <Key>0xFFB0: EnterCmdOnCmdLine("step/line") \n\
    <Key>0xFFB1: EnterCmdOnCmdLine("examine") \n\
    <Key>0xFFAC: EnterCmdOnCmdLine("go") \n\
    <Key>0xFF91,<Key>0xFFB0: EnterCmdOnCmdLine("step/into") \n\
    <Key>0xFF94,<Key>0xFFB0: EnterCmdOnCmdLine("step/over") \n\
    <Key>0xFF91,<Key>0xFFB1: EnterCmdOnCmdLine("examine^") \n\
    <Key>0xFFB5: EnterCmdOnCmdLine("show calls") \n\
    <Key>0xFF91,<Key>0xFFB5: EnterCmdOnCmdLine("show calls 3") \n\
    <Key>0xFF8D: activate()\n
!
! IDENTIFIER WORD SELECTION: (language-based delimiters)
! NOTE: DO NOT use any double click combinitation for the following resource
!       otherwise normal text selection in the source window will not work.
!
DebugSource.IdentifierSelectionSequence: Ctrl<Btn1Down>
!
! EXIT CONFIRMATION:
!
DebugDisplayExitConfirmDB:  True
!
! COMMAND ECHO:
!
DebugEchoCommands:   True
!
! TITLE FORMAT: Main window and optional view window.
!
! The following title format directives are supported:
!
!   %t - The title of the debugger application.
!   %p - The name of the user program being debugged.
!   %f - The name of the current file displayed in the source window.
!
DebugControl.TitleFormat: %t - %p: %f
!
! DRAG AND DROP MESSAGE SUPRESSION: (Dont mess with these)
!
*.dragInitiatorProtocolStyle: DRAG_NONE
*.dragReceiverProtocolStyle:  DRAG_NONE
|
By default, the key sequence for displaying the dialog box for conditional and action breakpoints is Ctrl/MB1 (see Section 10.4.6 and Section 10.4.7). To define another key sequence, edit the current definition of the following resource in the resource file. For example:
DebugSource.ModifyBreakpointToggleSequence: Ctrl<Btn1Down>(2) |
By default, the key sequence for language-sensitive text selection in the main window and instruction view is Ctrl/MB1 (see Section 10.5.1). To define another key sequence, edit the current definition of the following resource in the resource file. For example:
DebugSource.IdentifierSelectionSequence: Ctrl<Btn1Down> |
To avoid conflict with standard HP DECwindows Motif for OpenVMS word selection, do not
use a double-click combination, such as Ctrl<Btn1Down>(2).
10.10.4.3 Defining the Font for Displayed Text
To define another font for the text displayed in various debugger windows and views, edit the current definition of the following resources in the resource file. For example:
DebugDefault.Font: -*-COURIER-BOLD-R-*--*-120-*-*-*-*-ISO8859-1 |
To bind a different command to a key that is already associated with a command, edit the current definition of the following resources in the resource file. For example:
<literal>(<Key>)0xFFB0: EnterCmdOnCmdLine("step/line 3") \n\
|
To bind a command to a key that is not currently associated with a
command, refer to the Keysym Encoding chapter of the X and Motif
Quick Reference Guide for key designations.
10.11 Debugging Detached Processes
You cannot use the HP DECwindows Motif for OpenVMS user interface to the debugger to debug detached processes, such as print symbionts, which run without a command line interpreter (CLI).
To debug a detached process that runs without a CLI, use the character-cell (screen mode) interface to the debugger (see Section 1.11).
| Previous | Next | Contents | Index |