![[Compaq]](../../images/compaq.gif)
![[Go to the documentation home page]](../../images/buttons/bn_site_home.gif)
![[How to order documentation]](../../images/buttons/bn_order_docs.gif)
![[Help on this site]](../../images/buttons/bn_site_help.gif)
![[How to contact us]](../../images/buttons/bn_comments.gif)
![[OpenVMS documentation]](../../images/ovmsdoc_sec_head.gif)
| Document revision date: 30 March 2001 | |
|
|
|
|
|
|
| Previous | Contents | Index |
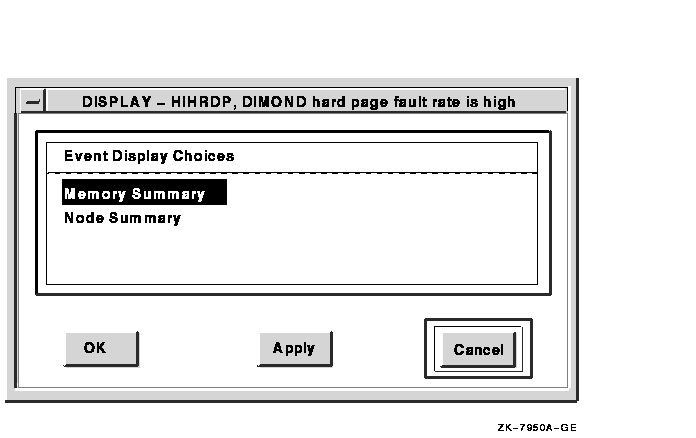
To display more information about an event, click MB3 on the event in the Event Log window, and then choose Display. Depending on the event, you have one or more event display choices that give you more information about the event. Figure 2-5 shows a sample event display choice dialog box.
Figure 2-5 Event Display Choice Dialog Box
To take corrective action on an event, click MB3 on the event in the Event Log window, and then choose Fix. Depending on the type of event, one or more of the following event fix choices are displayed (not all events have all fix options):
Adjust process working set
Crash node
Delete a process
Exit an image
Lower process priority
Purge process working set
Raise process priority
Resume a process
Suspend a process
See Chapter 4 for detailed information about performing fixes.
2.3.3 Sending Event Information to OPCOM
DECamds sends critical events to the operator communication manager
(OPCOM).
By default, events that meet both of the following criteria are sent to OPCOM:
You can change either criterion by choosing Filter Data... from the
Customize menu of the Event Log window. For more information on
changing Event Log filters, see Chapter 5.
2.3.4 Removing an Event from the Event Log Window
To remove an event from the Event Log window, click MB3 on an event,
and choose Remove from the menu. An event reappears if DECamds routine
sampling detects the same situation that caused the original log entry.
2.3.5 Retaining and Releasing an Event in the Event Log Window
Event Log entries are removed when the underlying cause is removed, so an event might disappear from the Event Log window. To retain the selected event in the Event Log window, click MB3 on an event and choose Freeze. When an event is frozen, the Time field is highlighted.
To release the selected event, click MB3 on the event and choose Unfreeze.
This chapter describes the DECamds data windows that you can display from the System Overview and Event Log windows.
Figure 3-1 shows the hierarchy of the DECamds data windows.
Figure 3-1 DECamds Data Window Hierarchy
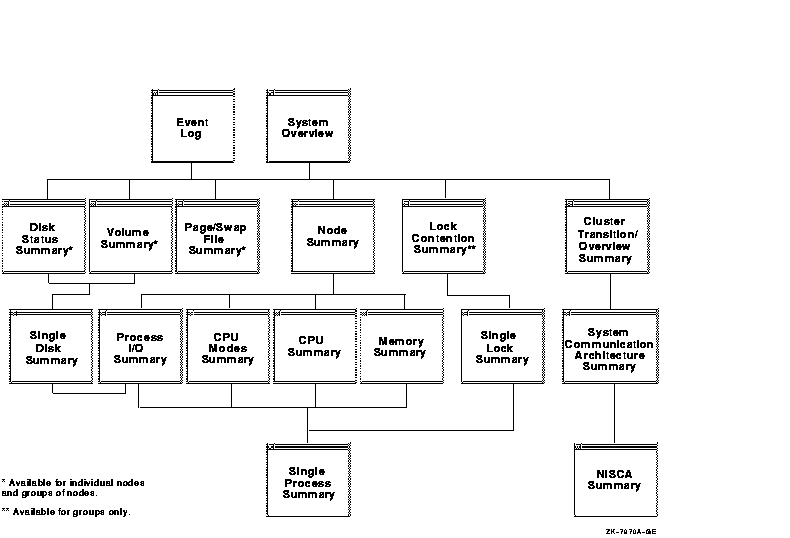
Table 3-1 describes the data windows and their functions.
| Window | Reference | Opened from Window | Displays |
|---|---|---|---|
| Disk Status Summary | Section 3.1 |
Event Log
System Overview |
Disk device data including path, volume name, status, and mount, transaction, error, and resource wait counts. |
| Volume Summary | Section 3.2 |
Event Log
System Overview |
Disk volume data, including path, volume name, disk block utilization, queue length, and operation count rate. |
| Single Disk Summary | Section 3.3 |
Disk Status Summary
Volume Summary |
Summary data about each node in a group in which a disk is available. |
| Page/Swap File Summary | Section 3.4 |
Event Log
System Overview |
Data about page and swap names and utilization, including free, used, and reserved pages. |
| Node Summary | Section 3.5 |
Event Log
System Overview |
Overview of a specific node's resource demand on the CPU state queues and processor modes, memory utilization, page faults, and I/O. |
| Process I/O Summary | Section 3.6 |
Event Log
Node Summary System Overview Single Disk Summary |
Statistics about I/O utilization by process, including buffered I/O, direct I/O, and page write I/O; also lists various I/O quotas. |
| CPU Modes Summary | Section 3.7 | Node Summary | A graphic representation of each CPU's processor modes, listing the process currently executing in the CPU. |
| CPU Summary | Section 3.8 |
Event Log
Node Summary System Overview |
Statistics about CPU utilization by process, including process state, priority, execution rate, CPU time, and wait time. |
| Memory Summary | Section 3.9 |
Event Log
Node Summary System Overview |
Statistics about memory usage by process, including process working set count, quota and extent, and paging rates. |
| Single Process Summary | Section 3.10 |
Event Log
Any data window |
Specific data about a process, basically a combination of data elements from the CPU, Memory, and Process I/O displays, as well as data for specific quota utilization, current image, specific process information, and wait queue time. |
| Lock Contention Summary | Section 3.11 |
Event Log
System Overview |
Data about each resource for which a potential lock contention situation exists. |
| Single Lock Summary | Section 3.12 |
Event Log
Lock Contention Summary |
Specific data about the blocking lock and any other locks in the granted, conversion, or waiting queues. |
| Cluster Transition/Overview Summary | Section 3.13 |
Event Log
System Overview |
Summary information about each node's membership in an OpenVMS Cluster. |
| System Communication Architecture Summary | Section 3.14 | Cluster Transition/Overview Summary | System Communication Architecture (SCA) information about a selected node's connection or connections to other nodes in a cluster. |
| NISCA Summary | Section 3.15 | System Communication Architecture Summary | Summary information about the Network Interconnect System Communication Architecture (NISCA) protocol, which is responsible for carrying messages to other nodes in the cluster. |
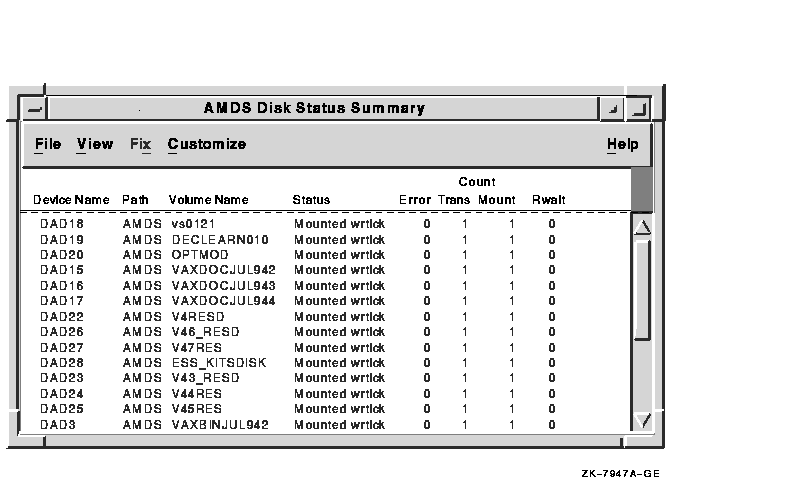
The Disk Status Summary window shown in Figure 3-2 displays data about availability, count, and errors of disk devices on the system.
Figure 3-2 Disk Status Summary Window
To open a Disk Status Summary window, do one of the following:
Table 3-2 describes the Disk Status Summary window data fields.
| Field | Displays | ||||||||||||||||||||||||||
|---|---|---|---|---|---|---|---|---|---|---|---|---|---|---|---|---|---|---|---|---|---|---|---|---|---|---|---|
| Device Name | The standard OpenVMS device name that indicates where the device is located, as well as a controller or unit designation. | ||||||||||||||||||||||||||
| Path | The primary path (node) from which the device receives commands. | ||||||||||||||||||||||||||
| Volume Name | The name of the media that is currently mounted. | ||||||||||||||||||||||||||
| Status |
One or more of the following disk status values:
|
||||||||||||||||||||||||||
| Errors 1 | The number of errors generated by the disk (a quick indicator of device problems). | ||||||||||||||||||||||||||
| Trans 1 | The number of currently-in-progress file system operations for the disk. | ||||||||||||||||||||||||||
| Mount 1 | The number of nodes that have the specified disk mounted. | ||||||||||||||||||||||||||
| Rwait 1 | An indicator that a system I/O operation is stalled, usually during normal connection failure recovery or volume processing of host-based shadowing. |
DECamds detects the following disk status-related events and displays them in the Event Log window. Node refers to the name of the node that is signaling the event. Disk refers to the name of the disk to which the event is related.
DSKERR, node disk disk error count is high
DSKINV, node disk disk is in an invalid state
DSKMNV, node disk disk mount verify in progress
DSKOFF, node disk disk is off line
DSKRWT, node disk disk Rwait count is high
DSKUNA, node disk disk is unavailable
DSKWRV, node disk wrong volume mounted
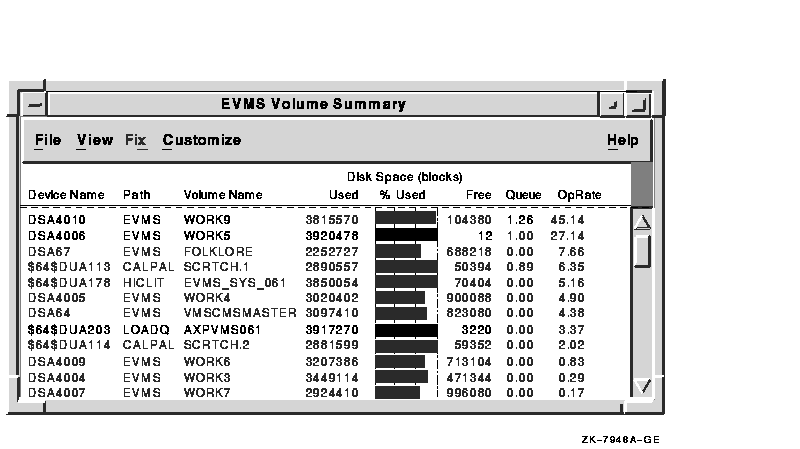
The Volume Summary window shown in Figure 3-3 displays summary data about disk volumes mounted in the system. Volume summary data is accurate when every node in an OpenVMS Cluster environment is in the same group. Multiple clusters can share a group, but clusters cannot be divided into different groups without losing accuracy.
Figure 3-3 Volume Summary Window
The group value for Free blocks used is determined from the node with the mastering lock on the volume resource. |
To open a Volume Summary window, do one of the following:
DECamds does not collect Volume Summary data on remote disks mounted using the VAX Distributed File Service (DFS). |
Table 3-3 describes the Volume Summary window data fields.
| Field | Displays |
|---|---|
| Device Name | The standard OpenVMS device name that indicates where the device is located, as well as a controller or unit designation. |
| Path | The primary path (node) from which the device receives commands. |
| Volume Name | The name of the mounted media. |
| Used | The number of volume blocks in use. |
| % Used | The percentage of the number of volume blocks in use in relation to the total volume blocks available. |
| Free | The number of blocks of volume space available for new data. |
| Queue | The average number of I/O operations pending for the volume (an indicator of performance; less than 1.00 is optimal). |
| OpRate | The rate at which the operations count to the volume has changed since the last sampling. The rate measures the amount of activity on a volume. The optimal load is device-specific. |
DECamds detects the following volume-related events and displays them in the Event Log window. Node refers to the name of the node that is signaling the event. Disk refers to the name of the disk to which the event is related. Group refers to the name of the group to which the event is related.
DSKQLN, node disk disk volume queue length is high
LOVLSP, group disk disk volume free space is low
The Single Disk Summary window shown in Figure 3-4 displays summary data about each node in the group in which a disk is available. This window is a node-by-node display of the data that is summarized in the Disk Status Summary and Volume Summary windows. The values displayed are those you would see if you displayed Disk Status Summary or Volume Summary for each node within the group.
You can use this display to determine both of the following:
Figure 3-4 Single Disk Summary Window
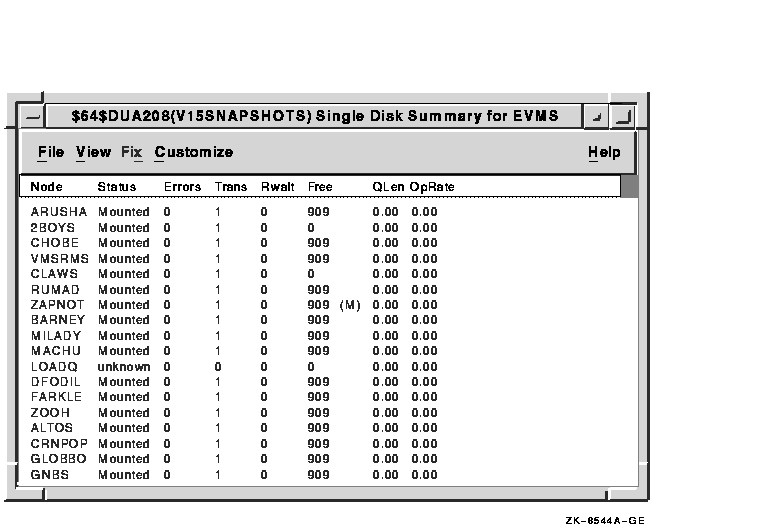
To open a Single Disk Summary window, follow these steps:
As an alternative to steps 3 and 4, you can can double-click MB1 on a line in the Disk Status Summary or Volume Summary window to display the Single Disk Summary window.
Note that when you click on an item, DECamds temporarily stops updating the window for 15 seconds or until you choose an item from a menu.
Table 3-4 lists the Single Disk Summary window data fields.
| Field | Displays |
|---|---|
| Node | Name of the node |
| Status | Status of the disk: mounted, online, offline, and so on |
| Errors | Number of errors on the disk |
| Trans | Number of currently-in-progress file system operations on the disk (number of open files on the volume) |
| Rwait | Indication of an I/O stalled on the disk |
| Free |
Count of free disk blocks on the volume
An (M) after the free block count indicates this node holds the lock on the volume that DECamds uses to obtain the true free block count on the volume. Other nodes might not have accessed the disk, so their free block count might not be up to date. |
| QLen | Average number of operations in the I/O queue for the volume |
| OpRate | Count of rate of change to operations on the volume |
From the Single Disk Summary window, you can display the Process I/O
Summary window. See Section 3.6 for more information.
3.4 Page/Swap File Summary Window
The Page/Swap File Summary window shown in Figure 3-5 displays data about a node's page/swap file usage and identifies page or swap files that are overused or underconfigured. It also displays nodes that lack a page or swap file.
Figure 3-5 Page/Swap File Summary Window
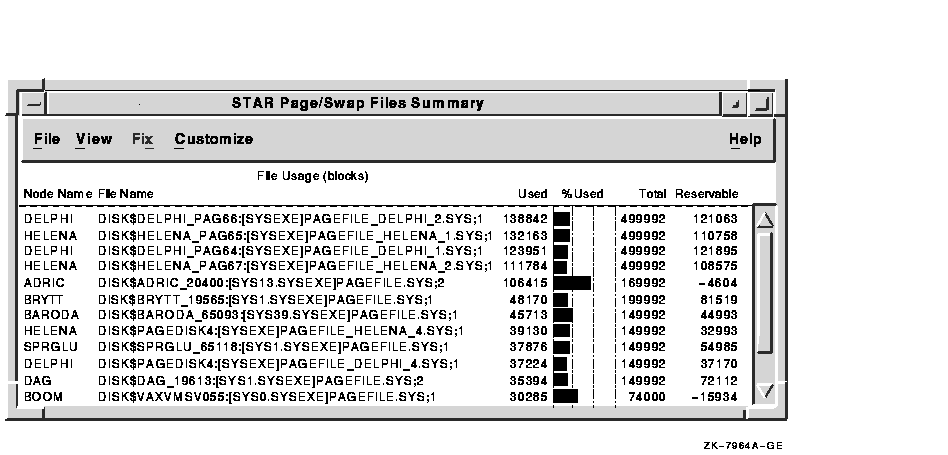
To open a Page/Swap File Summary window, do one of the following:
Table 3-5 describes the Page/Swap File Summary window data fields.
| Field | Displays |
|---|---|
| Node Name | The name of the node on which the page/swap file resides. |
| File Name | The name of the page/swap file. For secondary page/swap files, the file name is obtained by a special AST to the job controller on the remote node. DECamds makes one attempt to retrieve the file name. |
| Used | The number of used pages or pagelet blocks within the file. |
| % Used | A graph representing the percentage of the blocks from the available page or pagelet blocks in each file. |
| Total | The total number of pages or pagelet blocks within the file. |
| Reservable | The number of pages or pagelet blocks that can be logically claimed by a process for future physical allocation. This value can be listed as a negative value, because it is merely a value of a process's interest in getting pages from the file. If every process currently executing needed to use the file, then this value is the debt that is owed. |
DECamds detects the following page and swap file-related events and displays them in the Event Log window. Node is replaced by the name of the node to which the event is related.
LOPGSP, node file page file space is low
LOSWSP, node file swap file space is low
NOPGFL, node has no page file
NOSWFL, node has no swap file
| Previous | Next | Contents | Index |
|
|
| privacy and legal statement | ||
| 5929PRO_002.HTML | ||