HP OpenVMS Availability Manager User's Guide
1.3.3.1 Understanding OpenVMS Security Triplets
A security triplet determines which nodes can access system data from
an OpenVMS Data Collector node. The AMDS$DRIVER_ACCESS.DAT file on
OpenVMS Data Collector nodes lists security triplets.
On OpenVMS Data Collector nodes, the AMDS$AM_CONFIG logical translates
to the location of the
default security file, AMDS$DRIVER_ACCESS.DAT.
This file is installed on all OpenVMS Data Collector nodes.
A security triplet is a three-part record whose fields are separated by
backslashes (\). A triplet consists of the following fields:
- A network address (hardware address or wildcard character)
- An 8-character alphanumeric password
The password is not case
sensitive (so the passwords "testtest" and
"TESTTEST" are considered to be the same).
- A read, write, or control (R, W, or C) access verification code
The exclamation point (!) is a comment delimiter; any characters to the
right of the comment delimiter are ignored.
Example
All Data Collector nodes in group FINANCE have the following
AMDS$DRIVER_ACCESS.DAT file:
*\FINGROUP\R   ! Let anyone with FINGROUP password read
               !
2.1\DEVGROUP\W ! Let only DECnet node 2.1 with
               ! DEVGROUP password perform fixes (writes)
|
1.3.3.2 How to Change a Security Triplet
Note
The configuration files for DECamds and the Availability Manager are
separate; only one set is used, depending on which startup command
procedure you use to start the driver.
For more information about the configuration file setup for both
DECamds and the Availability Manager, see the HP Availability
Manager Installation Guide.
|
On each Data Collector node on which you want to change security, you
must edit the AMDS$DRIVER_ACCESS.DAT file. The data in the
AMDS$DRIVER_ACCESS.DAT file is set up as follows:
Network address\password\access
|
Use a backslash character (\) to separate the three fields.
To edit the AMDS$DRIVER_ACCESS.DAT file, follow these steps:
- Edit the network address.
The network address can be either of
the following:
- Hardware address
The hardware address field is the physical
hardware address in the LAN device chip. It is used if you have
multiple LAN devices or are running the HP DECnet-Plus for OpenVMS
networking software on the system (not the HP DECnet Phase IV for
OpenVMS networking software).
For devices provided by HP, the
hardware address is in the form 08-00-2B-xx-xx-xx, where the
08-00-2B portion is HP's valid range of LAN addresses as defined by the
IEEE 802 standards, and the xx-xx-xx portion is chip specific.
To determine the value of the hardware address on a node, use the
OpenVMS System Dump Analyzer (SDA) as follows:
$ ANALYZE/SYSTEM
SDA> SHOW LAN
|
These commands display a list of available devices. Choose the
template device of the LAN device you will be using, and then enter the
following command:
SDA> SHOW LAN/DEVICE=xxA0
|
- Wildcard address
The wildcard character (*) allows any incoming
triplet with a matching password field to access the Data Collector
node. Use the wildcard character to allow read access and to run the
console application from any node in your network.
Because the Data
Analyzer does not use this field, use the wildcard character in this
field in the AMDS$CONSOLE_ACCESS.DAT file.
Caution: Use of the wildcard character for
write-access security triplets enables any person using that node to
perform system-altering fixes.
- Edit the password field.
The password field must
be an 8-byte alphanumeric field. The Availability Manager forces
upper-case on the password, so "aaaaaaaa" and "AAAAAAAA" are
essentially the same password to the Data Collector.
The password
field gives you a second level of protection when you want to use the
wildcard address denotation to allow multiple modes of access to your
monitored system.
- Enter R, W, or C as an access code:
- R means READONLY access to the Data Analyzer.
- W means READ/WRITE access to the Data Analyzer. (WRITE implies
READ.)
- C means CONTROL access to the Data Analyzer. CONTROL allows you to
manipulate objects from which data are derived. (CONTROL implies both
WRITE and READ.)
The following security triplets are all valid; an explanation follows
the exclamation point (!).
*\1decamds\r   ! Anyone with password "1decamds" can monitor
*\1decamds\w   ! Anyone with password "1decamds" can monitor or write
2.1\1decamds\r ! Only node 2.1 with password "1decamds" can monitor
2.1\1decamds\w ! Only node 2.1 with password "1decamds" can monitor and
write
08-00-2b-03-23-cd\1decamds\w ! Allows a particular hardware address to
write
08-00-2b-03-23-cd\1decamds\r ! Allows a particular hardware address to read
node
|
OpenVMS Data Collector nodes accept more than one password. Therefore,
you might have several security triplets in an AMDS$DRIVER_ACCESS.DAT
file for one Data Collector node. For example:
*\1DECAMDS\R
*\KOINECLS\R
*\KOINEFIX\W
*\AVAILMAN\C
|
In this example, Data Analyzer nodes with the passwords 1DECAMDS and
KOINECLS are able to see the Data Collector data, but only the Data
Analyzer node with the KOINEFIX password is able to write or change
information, including performing fixes, on the Data Collector node.
The Data Analyzer node with the AVAILMAN password is able to perform
switched LAN fixes and other control functions.
You can choose to set up your AMDS$DRIVER_ACCESS.DAT file to allow
anyone on the local LAN to read from your system, but to allow only
certain nodes to write or change process or device characteristics on
your system. For example:
*\1DECAMDS\R
08-00-2B-03-23-CD\2NODEFIX\C
|
In this example, any Data Analyzer node using the 1DECAMDS password can
read data from your system. However, only the Data Analyzer node with
the hardware address 08-00-2B-03-23-CD and the password 2NODEFIX can
perform fixes and other control functions.
Note
After editing the AMDS$DRIVER_ACCESS.DAT file, you must stop and then
restart the Data Collector. This action loads the new data into the
driver. (See Section 2.1.3.)
|
1.3.4 Processing Security Triplets
The Availability Manager performs these steps when using security triplets to
ensure security among Data Analyzer and Data Collector nodes:
- A message is broadcast at regular intervals to all nodes within the
LAN indicating the availability of a Data Collector node to communicate
with a Data Analyzer node.
- The node running the Data Analyzer receives the message,
returns a password to the Data Collector, and requests system data from
the Data Collector.
- The password and network address of the Data Analyzer are used to
search the security triplets in the AMDS$DRIVER_ACCESS.DAT file.
- If the Data Analyzer password and network address match one of the
security triplets on the Data Collector, then the Data Collector and
the Data Analyzer can exchange information.
- If the Data Analyzer password and network address do not match any
of the security triplets, then access is denied and a message is logged
to OPCOM. (See Table 1-2 for more information on logging this type
of message.) In addition, the Data Analyzer receives a message stating
that access to that node is not permitted.
Table 1-1 describes how the Data Collector node interprets a
security triplet match.
Table 1-1 Security Triplet Verification
| Security Triplet |
Interpretation |
|
08-00-2B-12-34-56\HOMETOWN\W
|
The Data Analyzer has write access to the node only when the Data
Analyzer is run from a node with this hardware address (multiadapter or
DECnet-Plus system) and with the password HOMETOWN.
|
|
2.1\HOMETOWN\R
|
The Data Analyzer has read access to the node when run from a node with
DECnet for OpenVMS Phase IV address 2.1 and the password HOMETOWN.
|
|
*\HOMETOWN\R
|
Any Data Analyzer with the password HOMETOWN has read access to the
node.
|
Sending Messages to OPCOM
The logical names shown in Table 1-2 control the sending of messages
to OPCOM and are defined in the AMDS$LOGICALS.COM file on the Data
Collector node.
To put these changes into effect, restart the Data Collector with the
following command:
$ @SYS$STARTUP:AMDS$STARTUP RESTART
|
1.4 How Does the Availability Manager Identify Performance Problems?
When the Availability Manager detects problems on your system, it uses
a combination of methods to bring these problems to the attention of
the system manager. It examines both the types of data collected and
how often it is collected and analyzed to determine problem areas to be
signaled.
Performance problems are also posted in the Event pane, which is in the
lower portion of the System Overview window (Figure 1-1).
The following topics are related to the method of detecting problems
and posting events:
- Collecting and analyzing data
- Posting events
1.4.1 Collecting and Analyzing Data
This section explains how the Availability Manager collects and analyzes data.
It also defines related terms.
1.4.1.1 Events and Data Collection
The data that the Availability Manager collects is grouped into
data collections. These collections are composed of
related data---for example, CPU data, memory data, and so on. Usually,
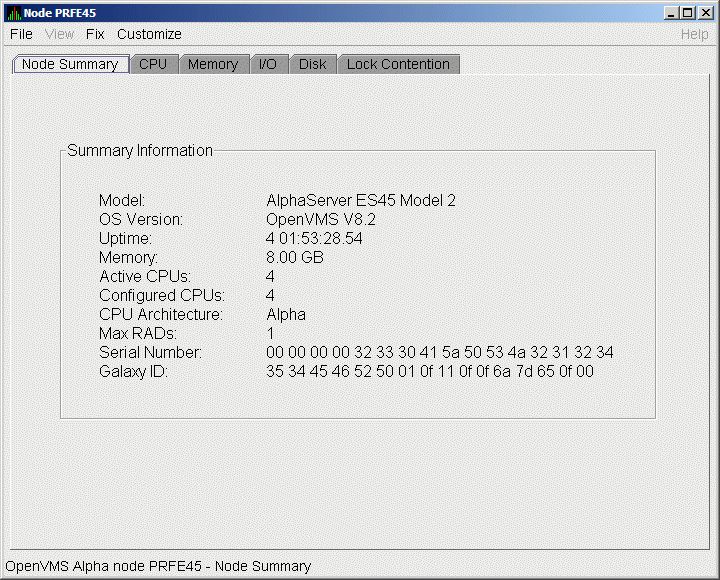
the data items on the tabs (like the ones displayed in Figure 1-5)
consist of one data collection.
Figure 1-5 Sample Node Summary

An event is a problem or potential problem associated
with resource availability. Events are associated with various data
collections. For example, the CPU Process data collection shown in
Figure 1-6 is associated with the PRCCUR, PRCMWT, and PRCPWT events.
(Appendix B describes events, and Appendix C describes the events
that each type of data collection can signal.) For these events to be
signalled, you must enable the CPU Process data collection, as
described in Section 1.4.1.2.
Users can also customize criteria for events, which is described in
Section 1.4.2.
1.4.1.2 Types of Data Collection
You can use the Availability Manager to collect data either as a background
activity or as a foreground activity.
Note that for either type of data collection, if you collect data for a
specific node, only that node is affected. If you collect data for a
group, all the nodes in that group are affected.
1.4.1.3 Data Collection Intervals
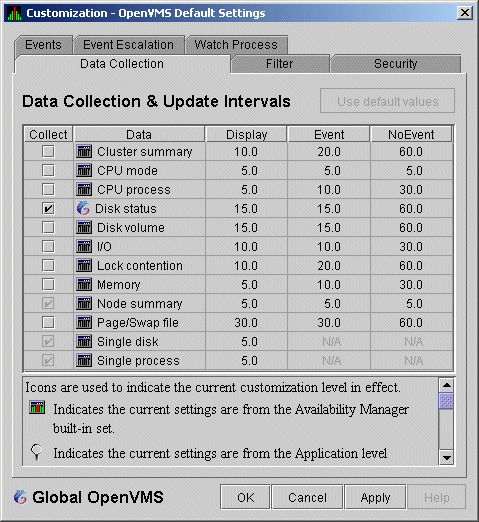
Data collection intervals, which are displayed on the
Data Collection customization page
(Figure 1-6), specify the frequency of data collection. Table 1-3
describes these intervals.
Table 1-3 Data Collection Intervals
| Interval (in seconds) |
Type of Data Collection |
Description |
|
NoEvent
|
Background
|
How often data is collected if no events have been posted for that type
of data.
The Availability Manager starts background data collection at the
NoEvent interval (for example, every 75 seconds). If
no events have been posted for that type of data, the Availability
Manager starts a new collection cycle every 75 seconds.
|
|
Event
|
Background
|
How often data is collected if any events have been posted for that
type of data.
The Availability Manager continues background data collection at the
Event interval until all events for that type of data
have been removed from the Event pane. Data collection then resumes at
the
NoEvent interval.
|
|
Display
|
Foreground
|
How often data is collected when the page for a specific node is open.
The Availability Manager starts foreground data collection at the
Display interval and continues this rate of collection
until the display is closed. Data collection then resumes as a
background activity.
|
1.4.2 Posting Events
The Availability Manager evaluates each data collection for events. The
Availability Manager posts events when data values in a data collection meet or
exceed user-defined thresholds and occurrences.
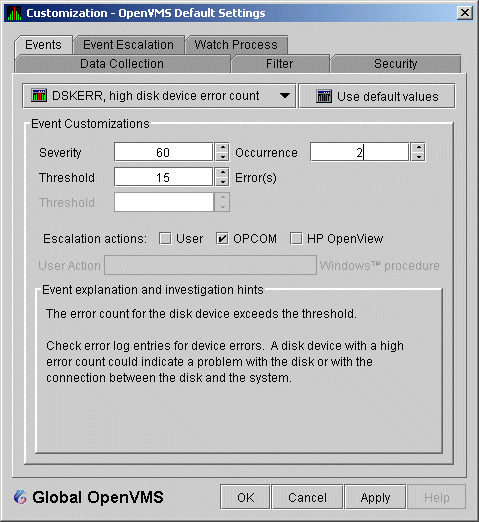
Values for thresholds and occurrences are displayed on Event
Customization pages similar to the one shown in Figure 1-7.
Thresholds and occurrences are described in the next section.
Figure 1-7 Sample Event Customization

1.4.2.1 Thresholds and Occurrences
Thresholds and occurrences are criteria that the Availability Manager
uses for posting events.
A threshold is a value against which data in a data
collection is compared. An occurrence is a value that
represents the number of consecutive data collections that meet or
exceed the threshold.
Both thresholds and occurrences are customizable values that you can
adjust according to the needs of your system. For details about how to
change the values for thresholds and occurrences, see Chapter 7.
Relationship Between Thresholds and Occurrences
For a particular event, when the data collected meet or exceed the
threshold, the data collection enters a threshold-exceeded state. When
the number of consecutive data collections to enter this state meets or
exceeds the value in the Occurrence box (see Figure 1-7), the
Availability Manager displays (posts) the event in the Event pane.
A closer look at Figure 1-7 shows the relationship between thresholds
and occurrences. For the
DSKERR, high disk device error count
event, a threshold of 15 errors has been set. A value of 2 in the
Occurrence box indicates that the number of errors during 2 consecutive
data collections must meet or exceed the threshold of 15 for the
DSKERR
event to be posted.
